Logs
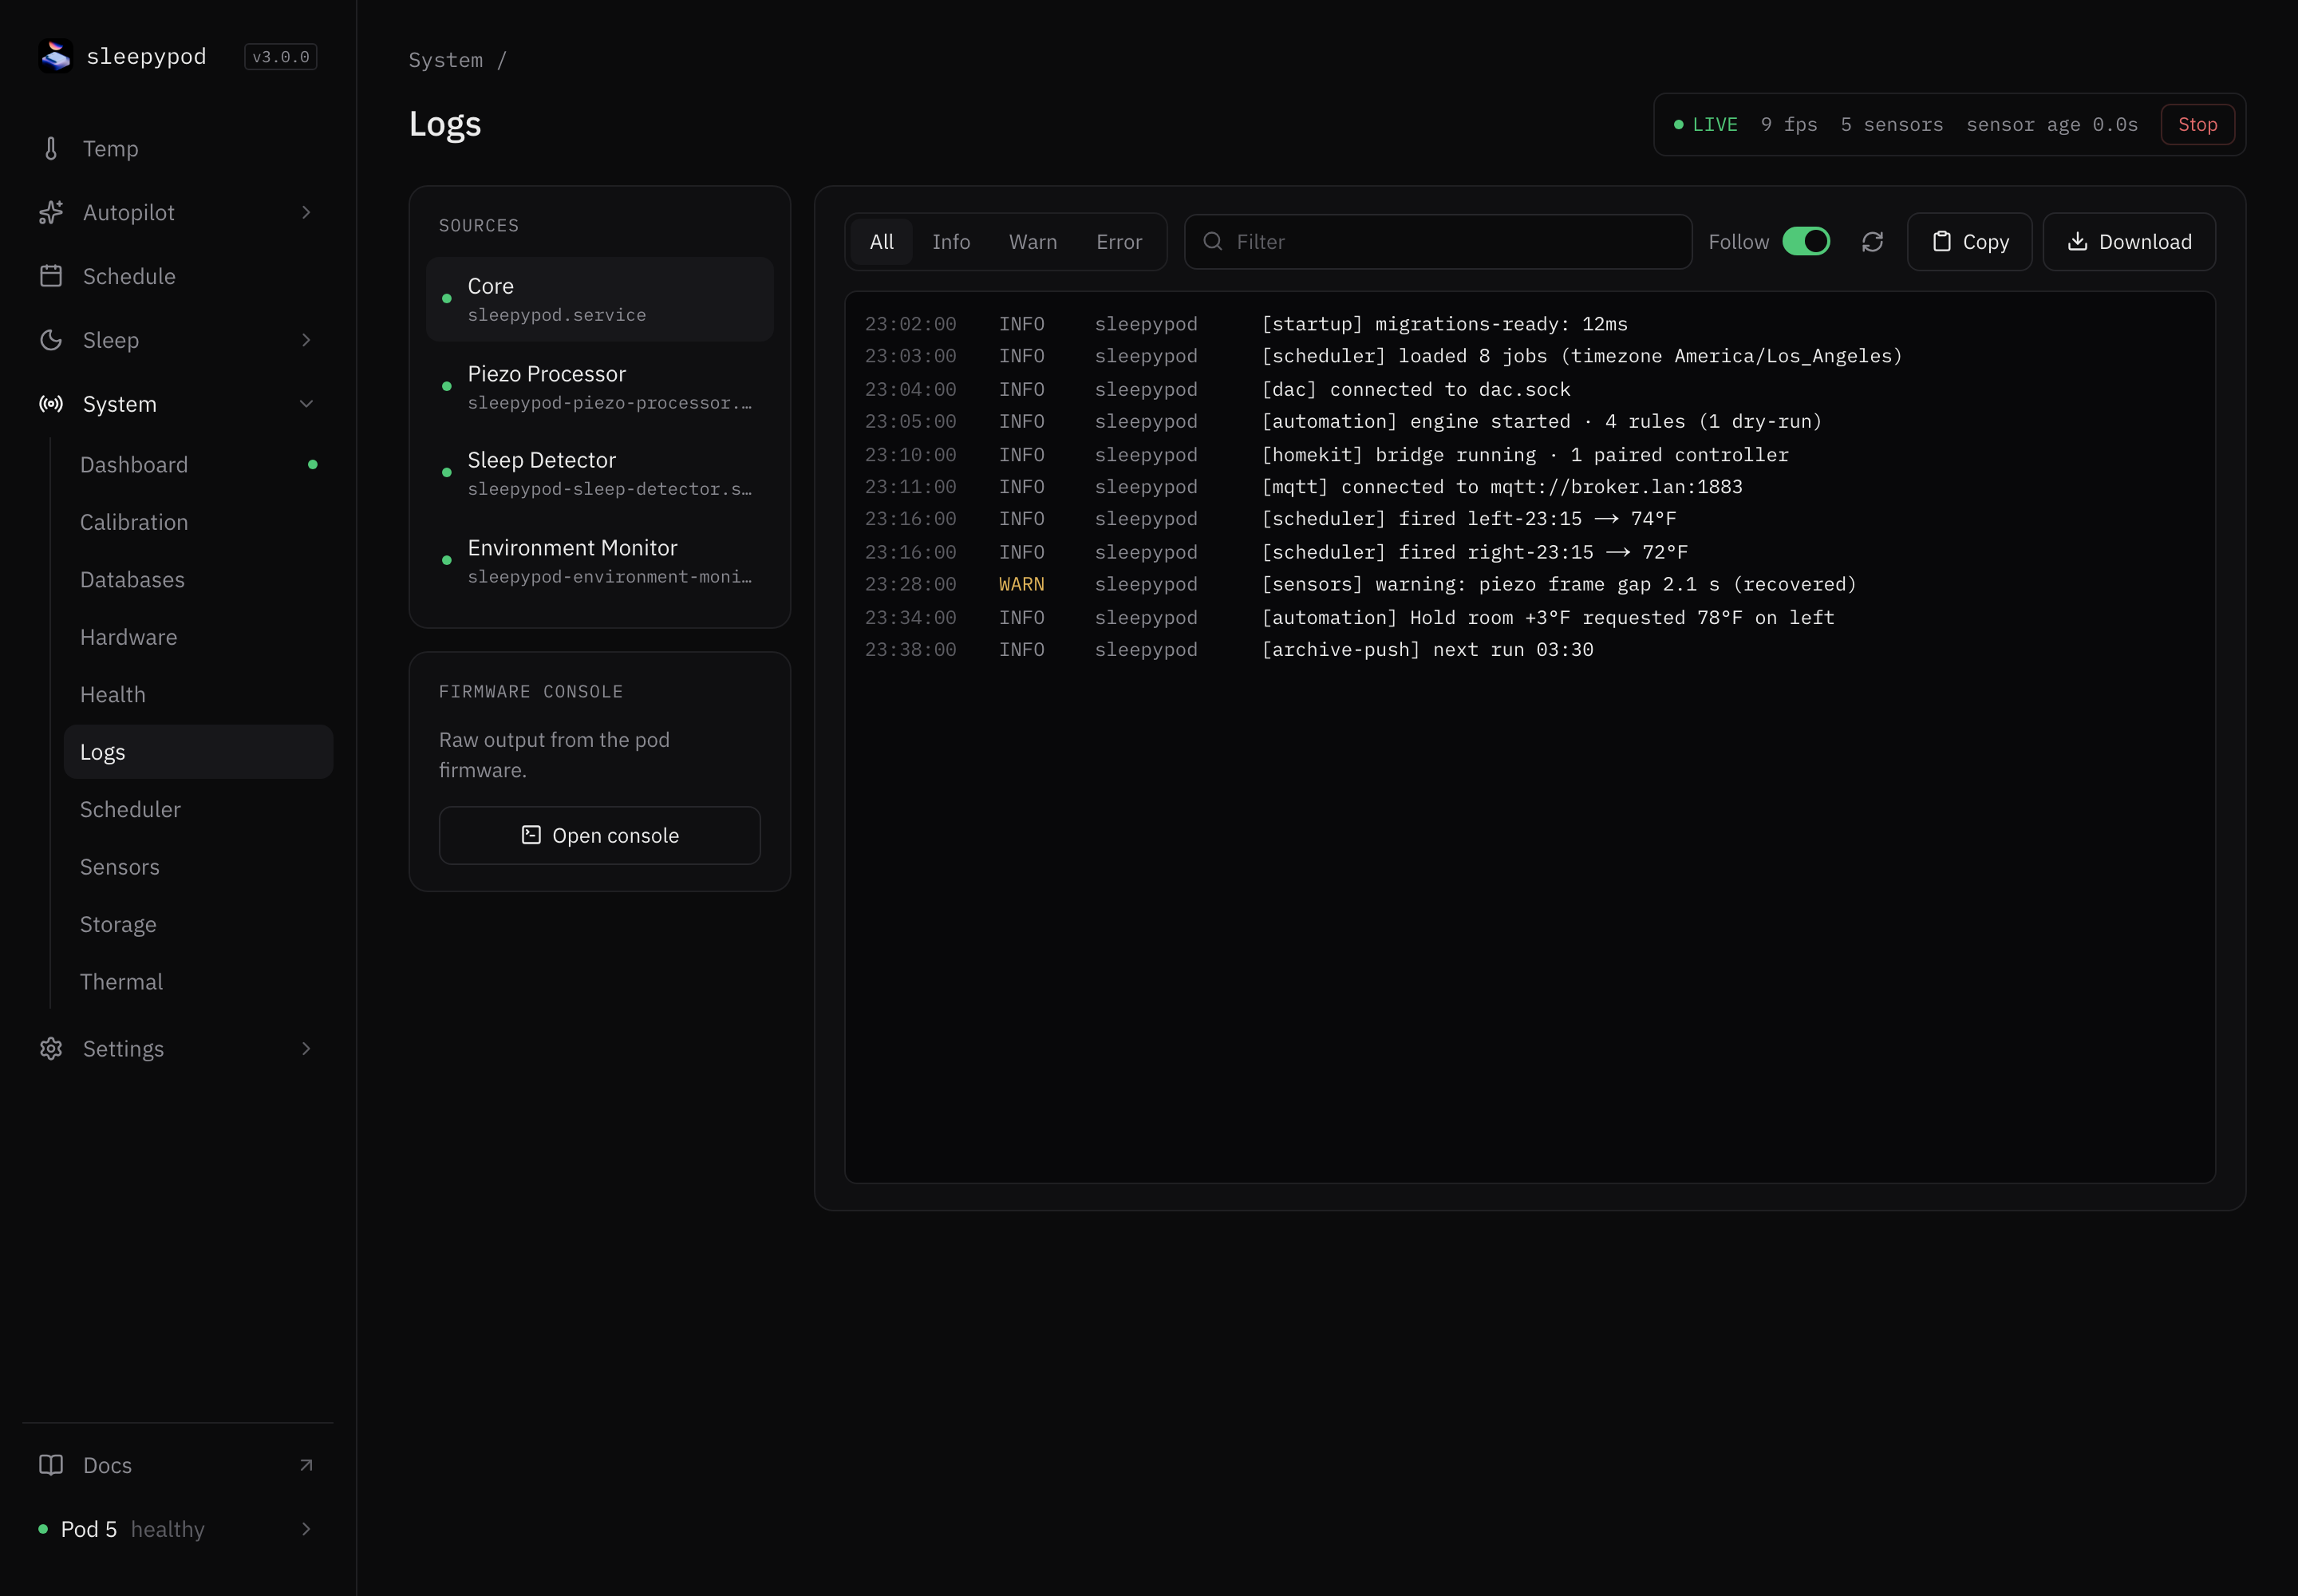
System → Logs shows recent messages from the Pod’s services. Read it when something failed and you want to know why. Nothing here changes the Pod.
Read a service’s log
- Under Sources, choose a service: Core, Piezo Processor, Sleep Detector, or Environment Monitor. A green dot means it is running.
- Filter by level with All, Info, Warn, or Error, or type in Filter to find a word.
- Leave Follow on to keep the newest lines in view as they arrive. Turn it off to scroll back.
The viewer shows the last 200 lines. Copy and Download save them for a bug report. Select the refresh button to reload.
The Health page’s Logs buttons open this page with the right service already chosen.
Firmware console
Open console shows raw output from the Pod’s firmware. Switch between Logs and Frames, filter by type, Pause or Resume, and Clear the view. Use it to check the firmware is sending data at all.
Source reference: Log viewer · Firmware console
Last updated on