System diagnostics
Open System for the Pod’s operating state. Settings holds configuration; Sleep holds night records and biometrics. The sidebar footer summarizes health and issues. Select the version or DEV chip for host, branch, and commit details when reporting a problem.
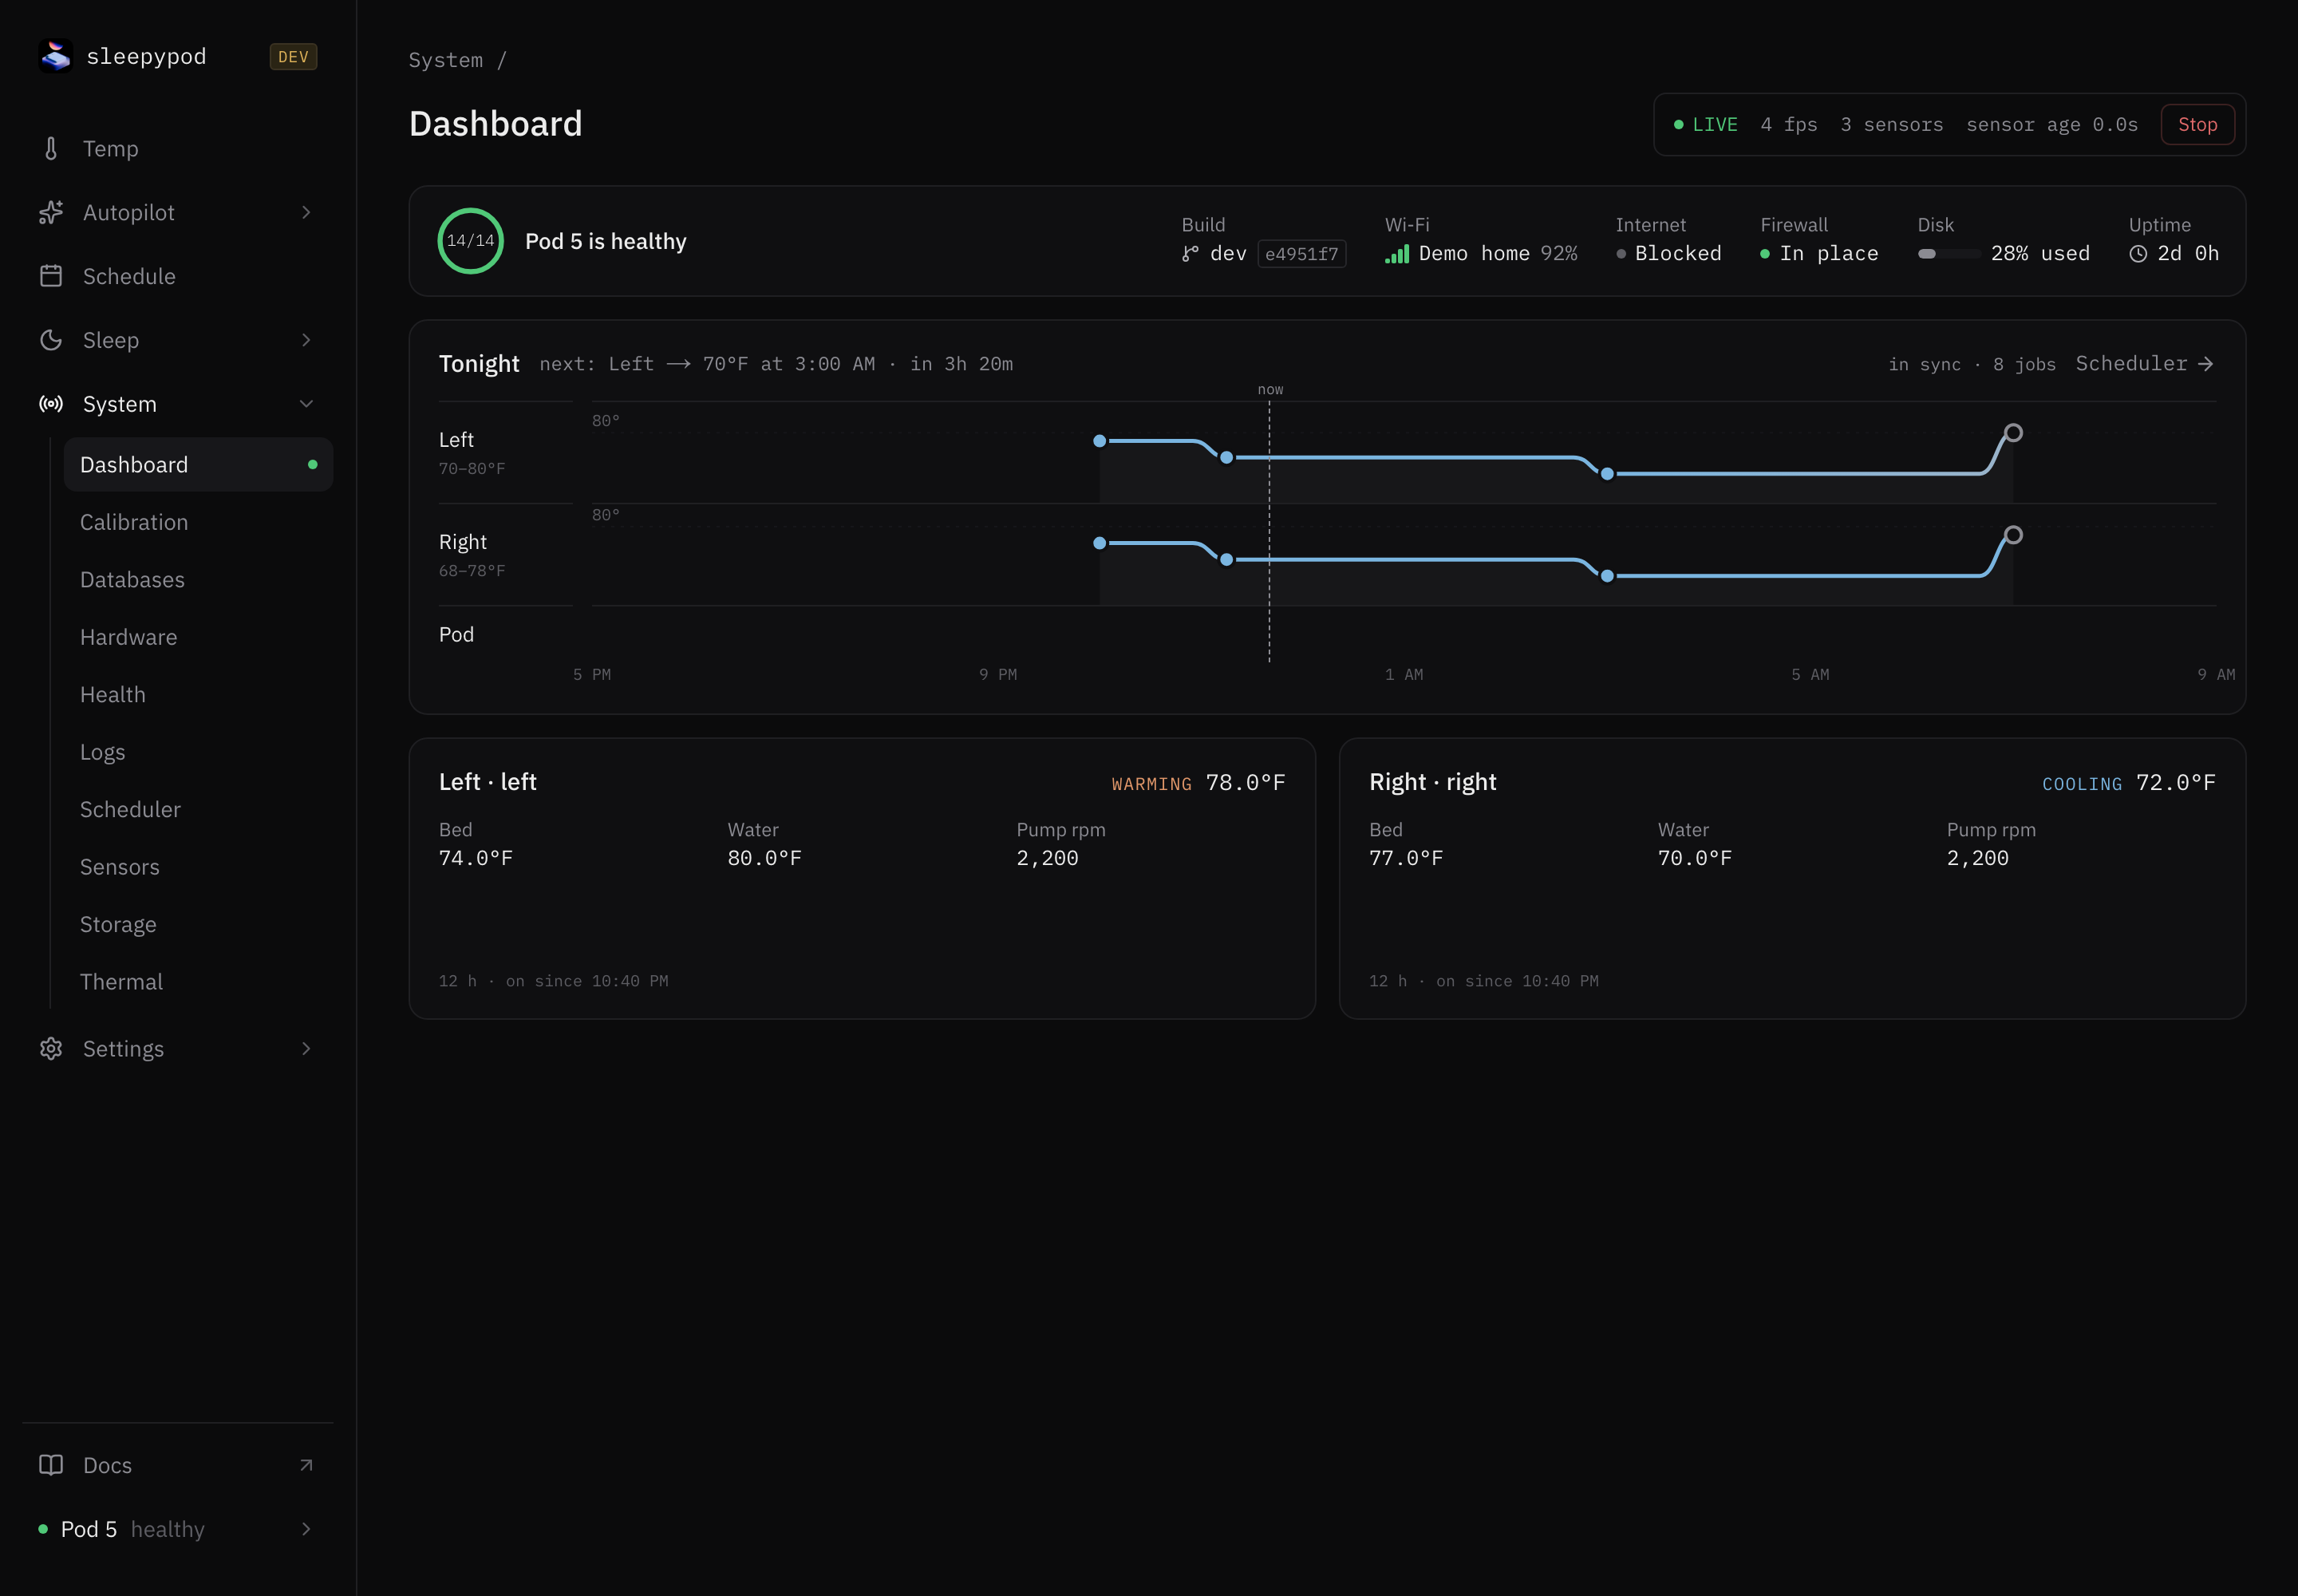
Choose the right view
| System page | Use it to |
|---|---|
| Dashboard | Start with the overall state, maintenance, and network status |
| Calibration | Inspect sensor calibration and its readiness |
| Databases | Inspect configuration and biometrics database state |
| Hardware | Exercise the available hardware diagnostics, including haptics |
| Health | Follow the data path and service health |
| Logs | Read service messages around a failure |
| Pipeline | Identify the sensor source and processing stages |
| Scheduler | Check registered jobs and their upcoming execution |
| Sensors | Inspect live sensor frames supported by this Pod |
| Storage | Inspect disk usage and preview cleanup |
| Thermal | Compare targets, water temperatures, and pump evidence |
Trace missing sleep data
- In Pipeline, identify whether this firmware produces RAW files or NATS frames.
- Check Sensors for fresh input. The existence of an archive is not required on NATS firmware.
- In Health, inspect the processing modules and their latest output.
- Check Databases and Logs for write or migration failures.
- Return to Sleep → Biometrics to inspect the results for the selected side and night.
See the sensor pipeline reference for transport selection and troubleshooting for command-line checks.
Follow the live data path
Health traces sensor readings through hardware, services, and core to the outputs. Moving links indicate recent data. Select a stage for details; use the 24-hour history and incident list to find interruptions. A running service can still have stale output.
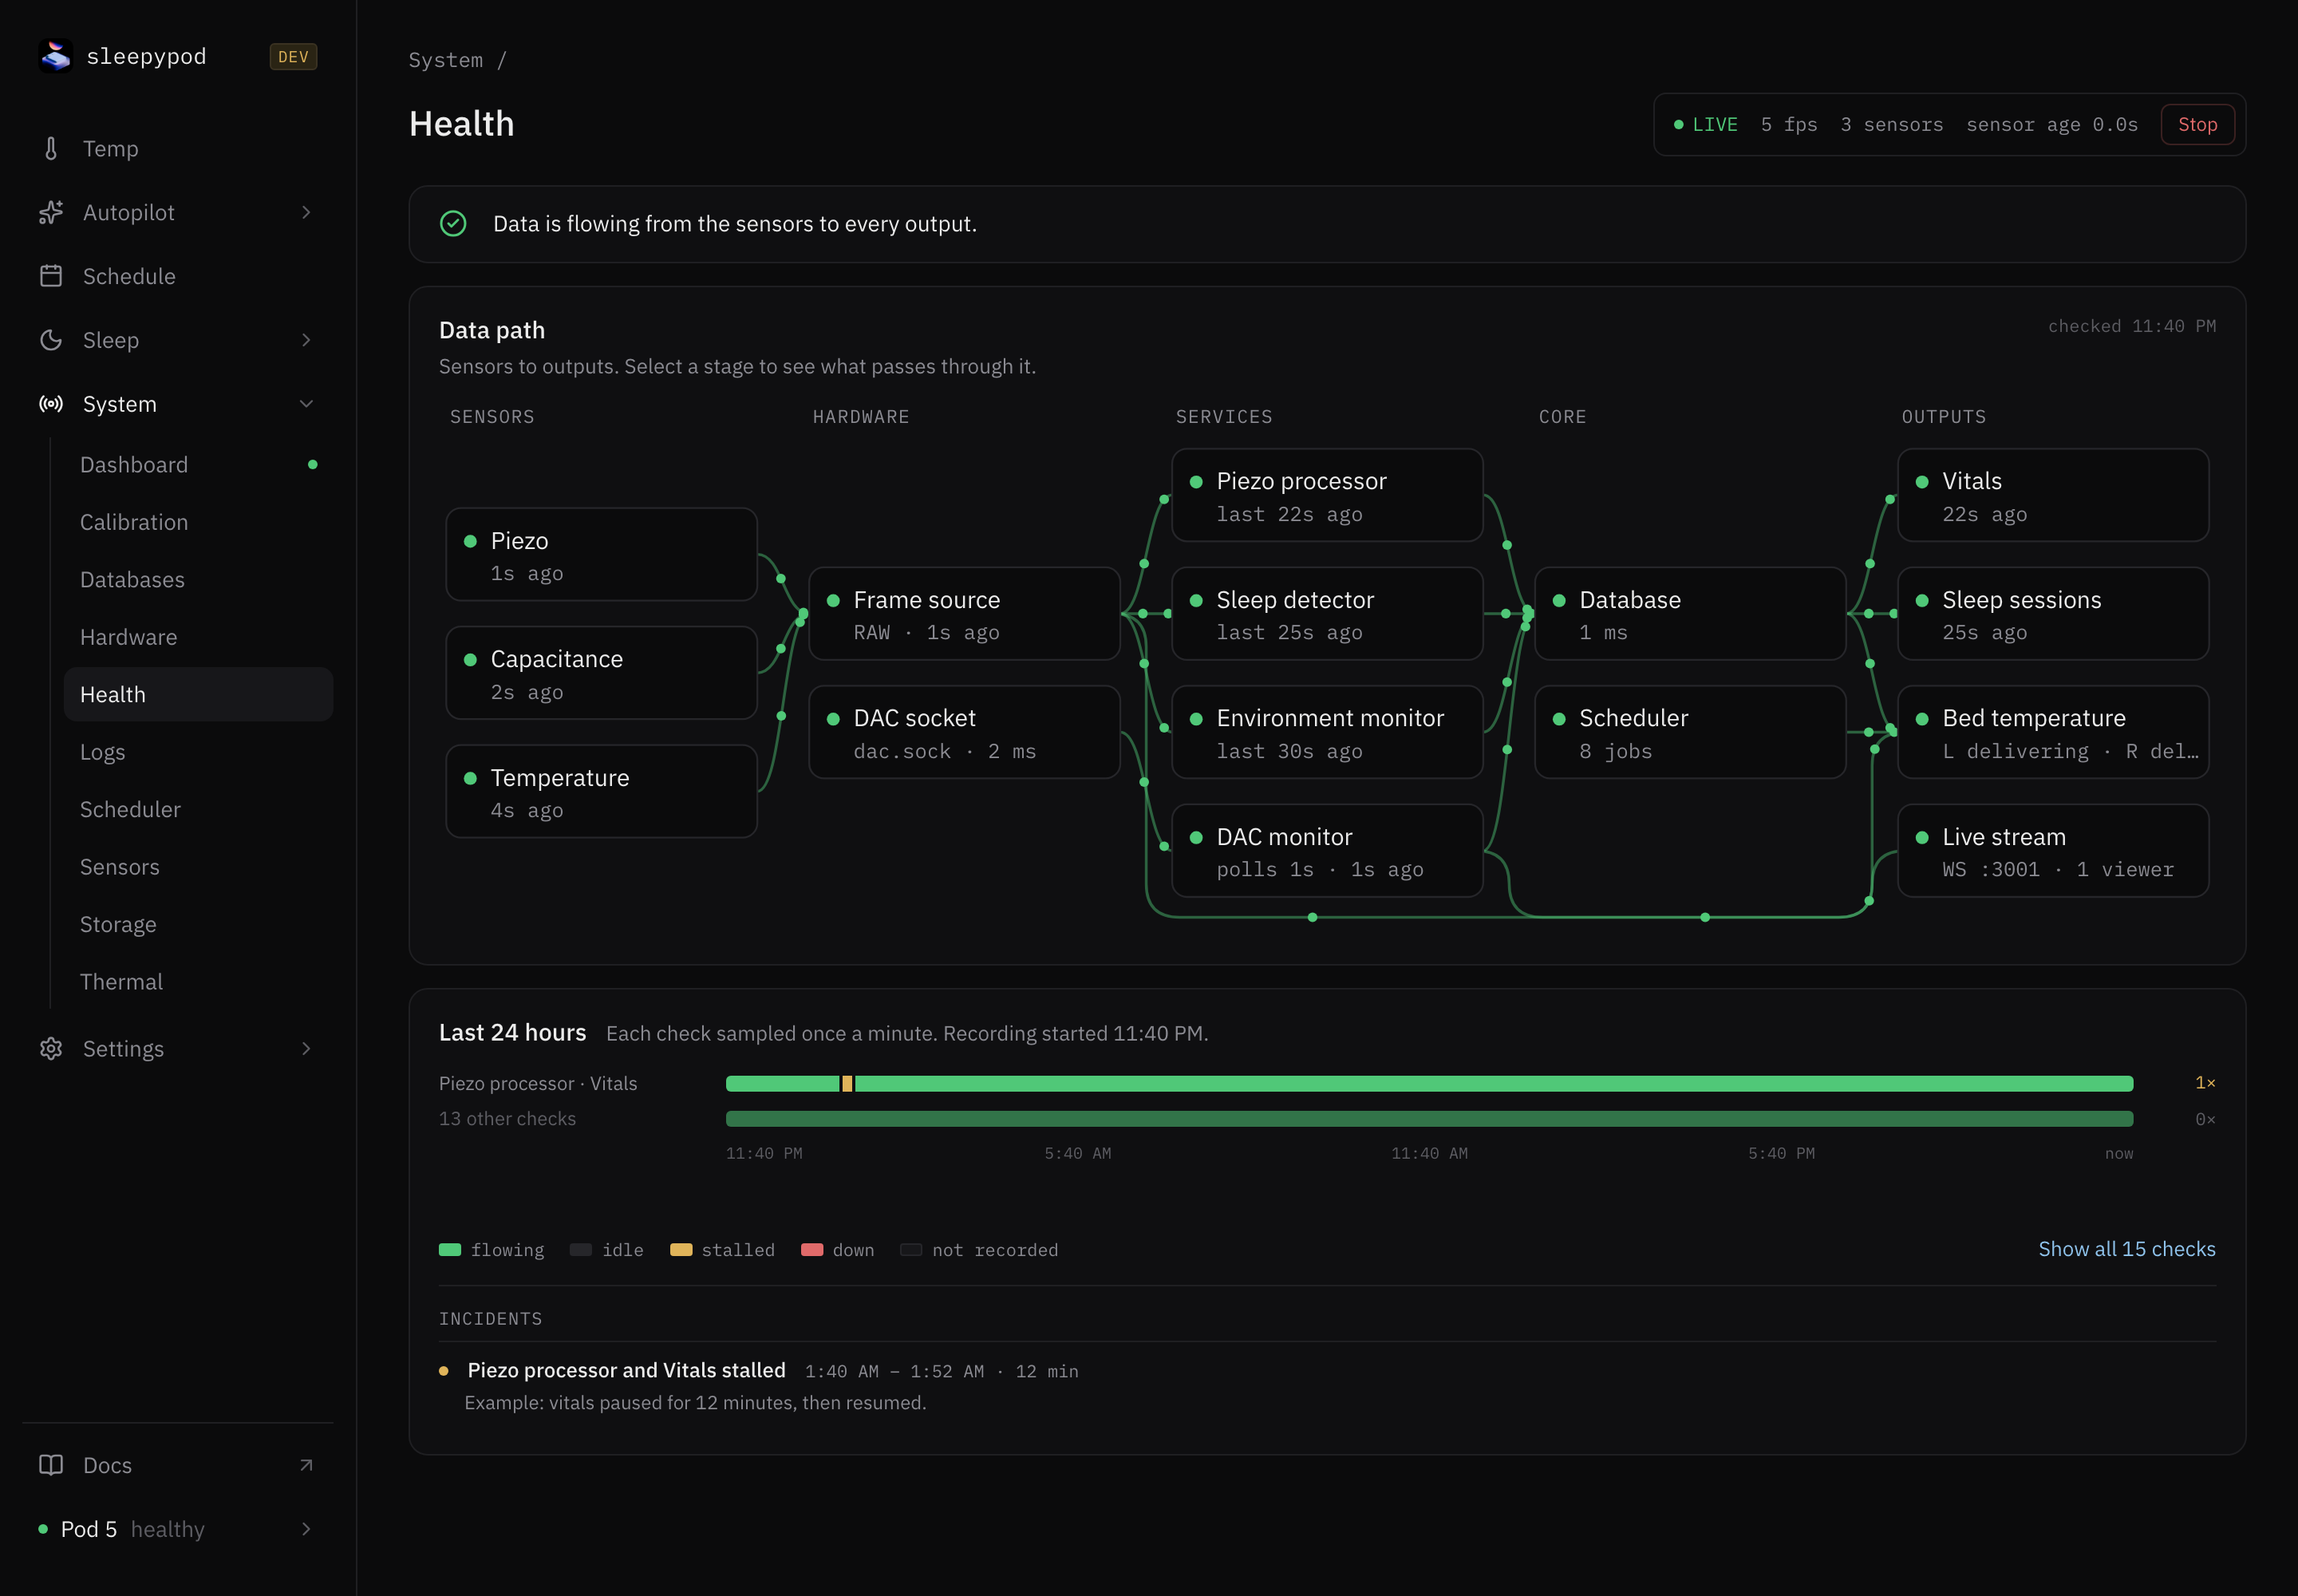
Watch the animated data-path walkthrough.
Investigate ineffective heating or cooling
Compare the selected side’s target with water temperature and recent pump readings in Thermal. A commanded power state is not proof of circulation. Pump telemetry varies by firmware; missing telemetry must not be interpreted as a measured zero RPM. Review the note and age of readings alongside the verdict.
Hardware tests send real commands. Run them deliberately with awareness of anyone using the bed. Calibration requires appropriate sensor conditions; a profile or a successful test is not a guarantee of valid overnight measurements.
Capture a useful support report
Record the app’s commit, Pod generation, affected side, local time and timezone, symptom, and relevant recent logs. From an installed Pod, sp-status reports the firmware and processing pipeline; sp-bundle-logs produces a diagnostic archive with redaction enabled by default. Inspect the archive before sharing it.
Source reference: System navigation · Debugging runbook · Support tools