Health
System → Health follows sensor data from the bed, through the Pod’s services, to what you see in the app. Use it when a night is missing vitals or a reading looks stale.
Verdict
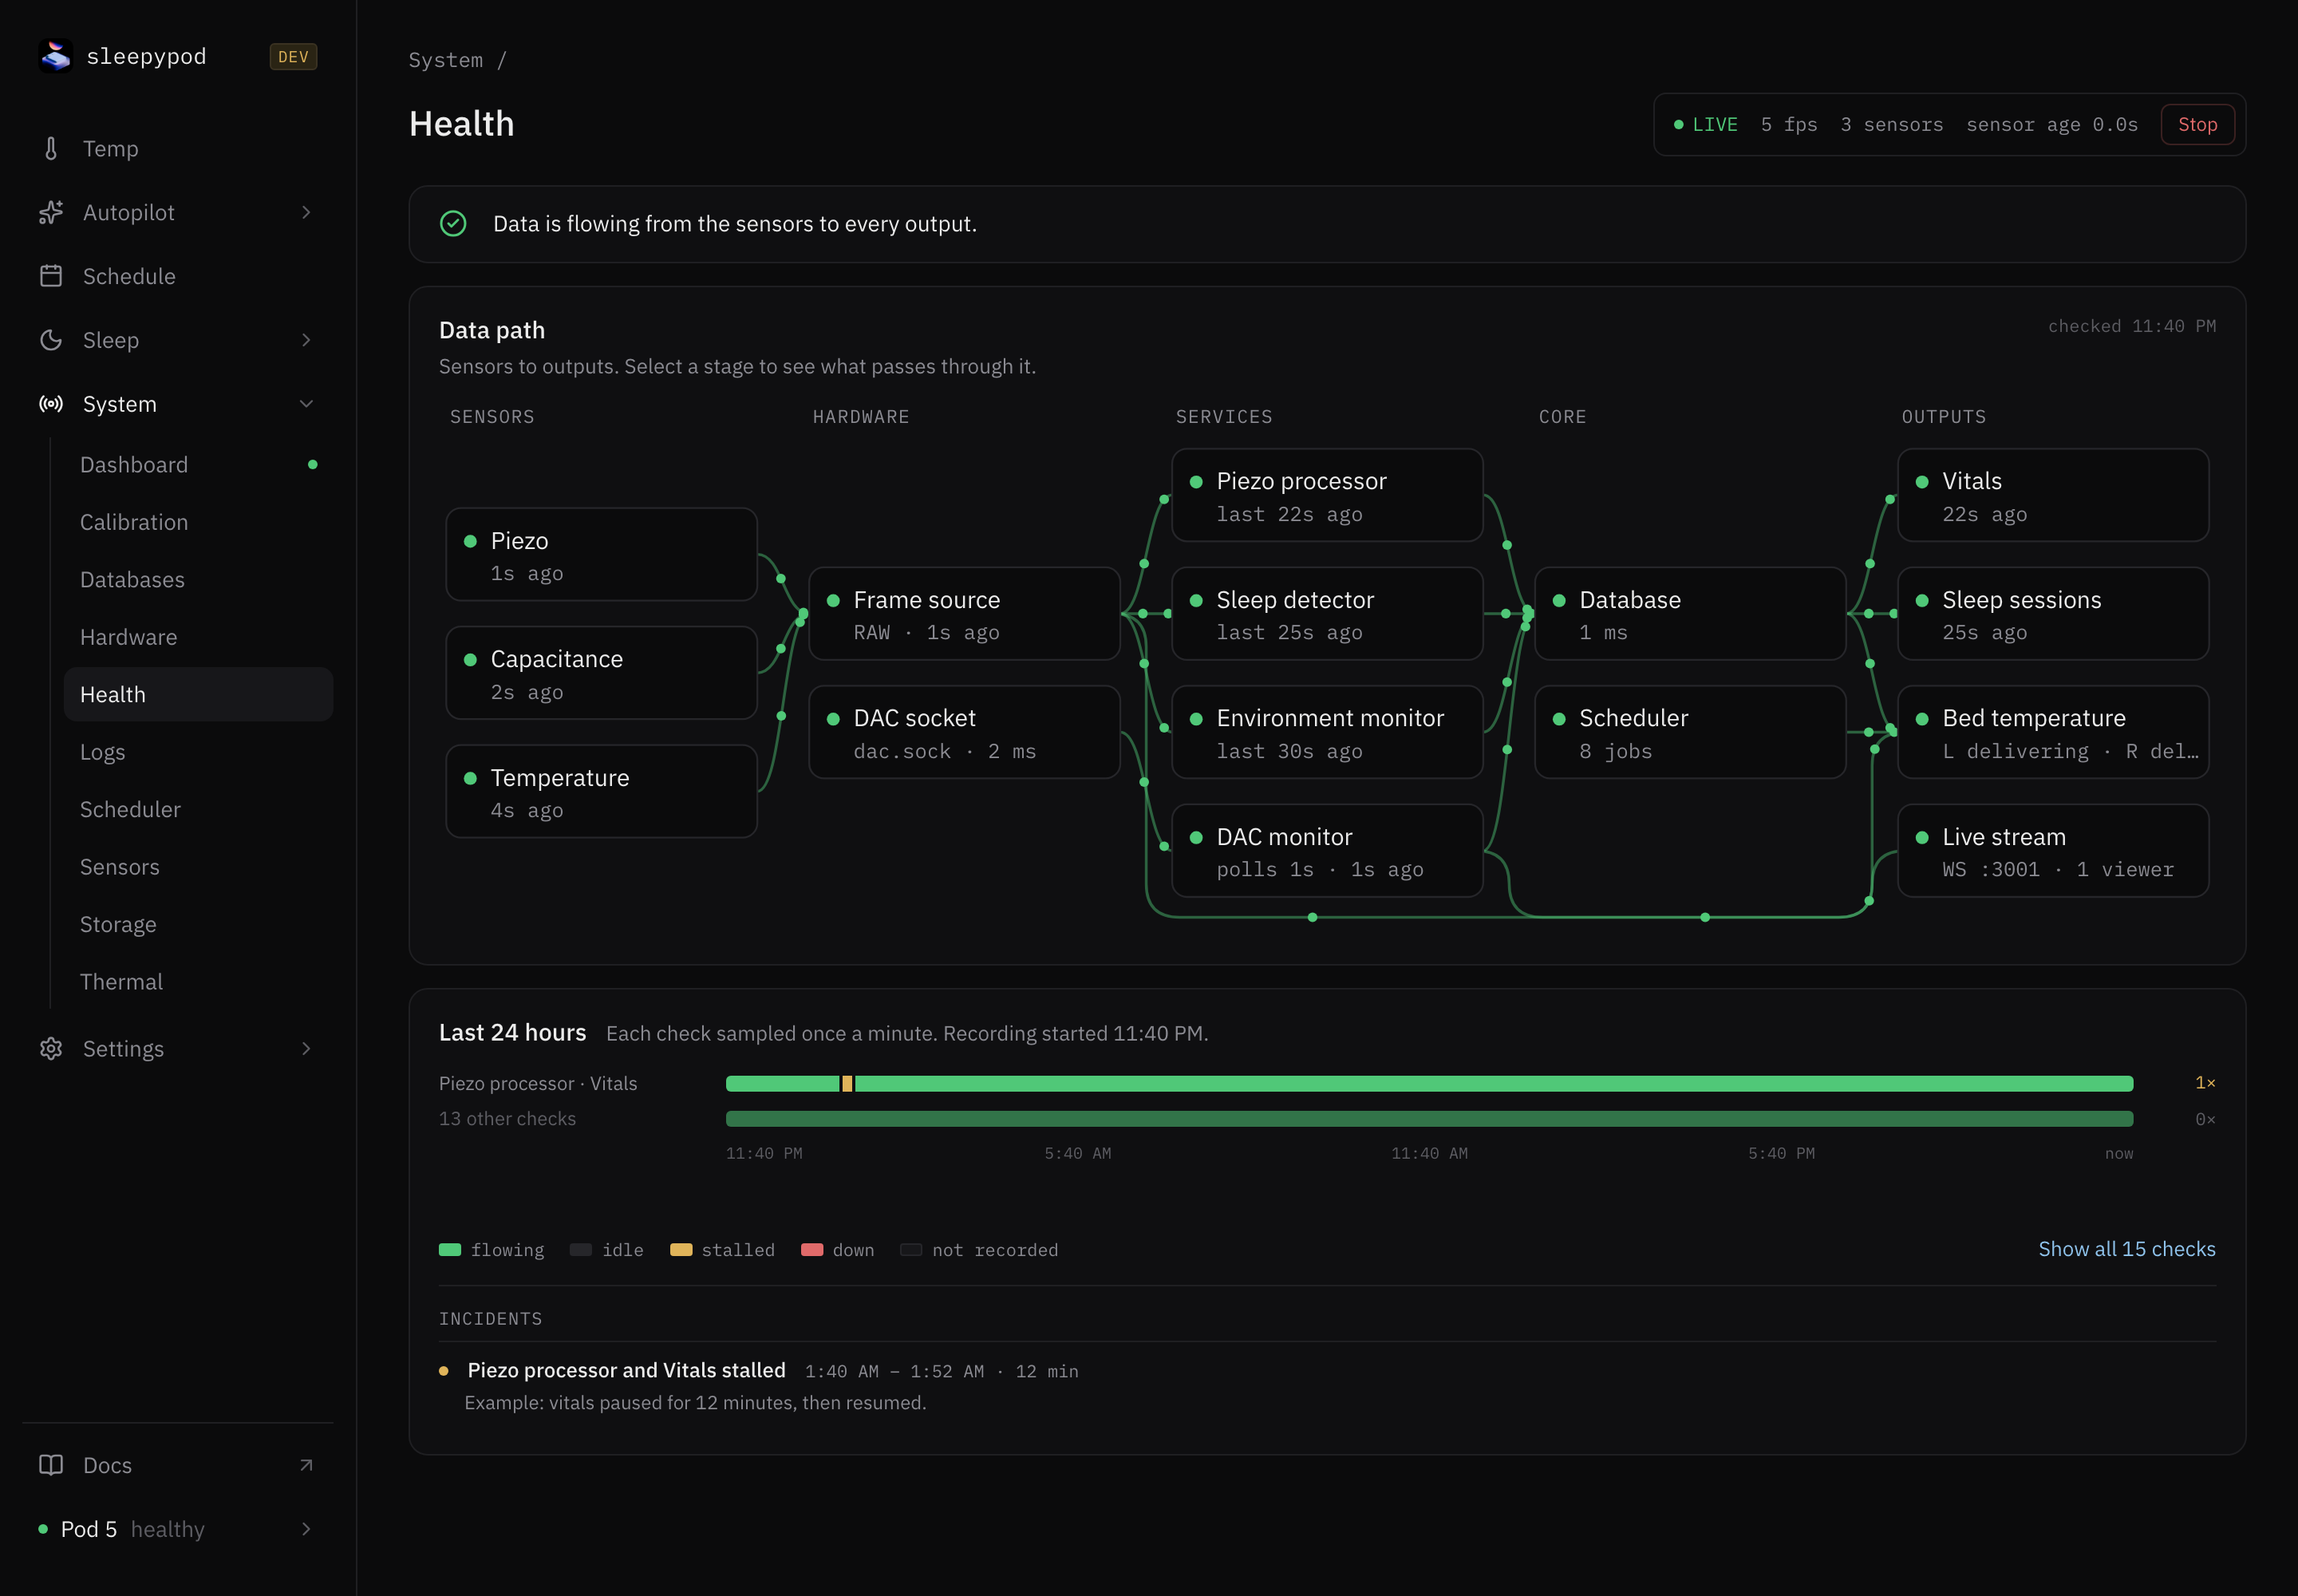
The line at the top sums things up, for example Data is flowing from the sensors to every output. When something is wrong it names the problem and offers a fix: a link to the right page, Logs and Restart for a stopped service, or the empty-bed question described on the Dashboard. Restart restarts that service on the Pod.
Data path
The map has five stages, from left to right:
| Stage | Nodes |
|---|---|
| Sensors | Piezo, Capacitance, Temperature |
| Hardware | Frame source (RAW files or live stream), DAC socket |
| Services | Piezo processor, Sleep detector, Environment monitor, DAC monitor |
| Core | Database, Scheduler |
| Outputs | Vitals, Sleep sessions, Bed temperature, Live stream |
Moving dots show data that arrived recently. Each node shows how long ago it last produced something. Select a node to see details, and Logs to open Logs for that service. Live stream shows the stream’s sensors and a Raw frames view.
A service can be running and still have stale output, so read the age, not just the dot. Watch the animated walkthrough.
Last 24 hours and incidents
Each check is sampled once a minute. The strips show when it was flowing, idle, stalled, down, or not recorded. Show all N checks expands the list. Incidents lists each interruption with its time and length.
Trace missing sleep data
- In the Data path, check Frame source: it says whether this firmware writes RAW files or streams frames. A RAW archive is not needed on streaming firmware.
- Check Sensors for fresh readings.
- Check the Piezo processor and Sleep detector nodes, and the incidents list, for when output stopped.
- Check Databases and Logs for write errors.
- Return to Sleep → Biometrics for that side and night.
See the sensor pipeline reference and troubleshooting for command-line checks.
Source reference: Health panel · Data path model · Debugging runbook